User guide
- Getting started with CatchJS
- Disabling screenshots and click trails
- Associating a domain with your account
- Quotas
- What performance metrics are tracked, and what they mean
- How performance monitoring works
- How time-on-page is measured
- How pageview counting happens
- How error logging works
- Error grouping
- Screenshots
- Generic logging via catchjs.log()
- What makes CatchJS fast?
- Privacy protection
Getting started with CatchJS
Adding CatchJS to your site is simple.
Sign up
The first step is to sign up to a plan. Choose the plan that fits your expected usage pattern. You can change this at any time.
Connect your account with a domain
Once you have an account and you are logged in, go to the connected site section of your account settings page. Click your name in the top right, and then on "Account settings".
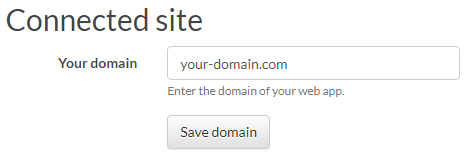
Enter the domain you want to associate with your account. For more information, see the section on associating a domain with your account.
Link the CatchJS script file
Add the following HTML to your site to start logging errors.
<script src="https://cdn.catchjs.com/catch.js"></script>
That's it. The CatchJS script will automatically set up tracking of JavaScript errors, web performance and time-on-page for the pages where the script is loaded. The data tha is collected will show up in your CatchJS dashboard.
Disabling screenshots and click trails
You can customize the error reporting to meet your needs. If you want to disable the screenshots feature, or not collect click trails, you can use the configuration builder below to generate an appropriate configuration.
Configuration happens via the configuration object catchjs_config. Defining this object is optional, but if you want to use a custom configuration, you must define the configuration object prior to loading the catch.js script, in order for the catch.js script to be able to use it. The configuration object can be altered at runtime as long as the object is defined prior to loading the script, giving you fine grained control over what is collected and when.
Example syntax:
window.catchjs_config = {
    "screenshots": false,
    "clicks": false
};
catchjs_config.screenshots: If the property is defined and has the value of false, collection of screenshots will be disabled. Default value: true.
catchjs_config.clicks: If the property is defined and has the value of false, collection of clicks will be disabled. Clicks are sent along with screenshots, so setting this property to true while screenshots === false will still not result in the collection of click trails, since the collection of screenshots are needed for clicks to be collected and displayed. Default value: true.
You can use the configuration generator below to build your configuration object.
Configuration generator
<script src="https://cdn.catchjs.com/catch.js"></script>
The above snippet can be added to your site's HTML to load the error tracking script, while using the configuration you've chosen.
Associating a domain with your account
When creating your account, you are asked to enter a domain from which you want to log errors and other data. Accounts on the Developer and Production plans can associate one domain with their account, while accounts on the Enterprise plan can associate 25 domains to their account. You can change the domain associated with your account at any time.
Once a domain has been associated with your account, it will accept logged data from that domain and any of its subdomains.
For example, if you associate your account with example.com, you can log errors from example.com, www.example.com, staging.beta.example.com and so on.
If you associate your account with www.example.com, you can log from that domain, but not from example.com. For this reason, be mindful when adding the "www" prefix before the domain you associate your account with, as this will require "www" prefix to be present for the logged data to be accepted.
You should not add a protocol scheme, such as "http://" or "https://" to the associated domain.
When the CatchJS script sends data, either because an uncaught exception happened or via the catchjs.log() function, it passes along the value of window.location.hostname which holds the domain of the current document, including any subdomains. This value must be the same as or be a sub-domain of the domain associated with your account for the data to be logged.
Associating domains that are on the public suffix list is disallowed. This list contains domains where sub-domains can be registered by the public. An example of such a domain is github.io, where users can create pages on <username>.github.io. Because github.io is on the public suffix list, you can't associate your account to the entirety of github.io, but you are free to associate your CatchJS account with any specific subdomain of it, such as <username>.github.io.
Quotas
Each account type has an associated quota of tracked JavaScript errors and generic catchjs.log() calls that can be logged per month, as well as a limit on the number of URLs that are included in performance monitoring, time-on-page and pageviews measurements. There's no charge when the quotas are reached. If a quota is reached, CatchJS will simply ignore any further logged data, without charging you for the extra use. Each quota is counted separately, so you can fill up one quota and continue using another. There is a maximum number of screenshots that will be taken per unique error type, which helps ensure that the screenshot quota is used on errors for which screenshots have not yet been collected.
Screenshot quotas are reset every day. Logging quotas are reset at the start of each month.
Web performance monitoring and time-on-page measurements is enabled for the URLs with the most pageviews in the past week, up to the URL quota for that measurement. In the first week, these measurements are enabled for the first URLs from which measurements are sent, up to the URL quota.
| Development | Production | Enterprise | |
|---|---|---|---|
| Errors per month | 1 000 | 100 000 | 1 000 000 |
catchjs.log() calls per month |
1 000 | 100 000 | 1 000 000 |
| Screenshots per day | 0 | 100 | 100 |
| Screenshots requested per unique error type | 0 | 10 | 10 |
| URLs for performance metrics | 100 | 1 000 | 10 000 |
| URLs for time-on-page | 100 | 1 000 | 10 000 |
| URLs for pageviews | 10 000 | 100 000 | 1 000 000 |
| Number of associated domains | 1 | 1 | 25 |
| Data retention | 3 months | 3 months | 3 months |
What performance metrics are tracked, and what they mean
CatchJS tracks a number of metrics that relate to the speed of page load, and how fast the user experience is. This includes three metrics known as the Core Web Vitals: Cumulative Layout Shift, Largest Contentful Paint and First Input Delay. These three metrics are particularly important as they relate directly to how fast the page load experience was for the user. Google has stated that they use the 75th percentile values for these metrics as a signal to determine how a page ranks in their search results. These metrics are shown in a green-yellow-red color scale in your performance overview. Getting these metrics to green for a page may cause the page to rank better in Google search results.
- Largest Contentful Paint: Largest Contentful Paint measures the time of the largest paint event from a content element as reported by the
largest-contentful-paintperformance observer in browsers that support it. - Cumulative Layout Shift: Cumulative Layout Shift measures the maximum sum of the proportion of layout shift over all measurement windows. Measurement windows reset after 5 seconds or after a 1 second interval without layout shift. Layout shifts occurring after a recent user input are ignored. Measured via the
layout-shiftperformance observer in browsers that support it. - First Input Delay: First Input Delay measures the time between when a user first interacts with the page until the browser is able to begin processing that interaction, as reported by the
first-inputperformance observer in browsers that support it. - First Contentful Paint: First Contentful Paint is the time of the first paint event of a content element, measured via the
paintperformance observer in browsers that support it. - First Paint: First Paint is the time of the first paint event in the browser, measured via the
paintperformance observer in browsers that support it. - Client time: Client time measures the time between when the first byte of the HTTP response is received until the load event has fired in the browser. Measured as
loadEventEnd - responseStart. - Server time: Server time measures the time between when the connection establishes until the first byte of the HTTP response is received. Measured as
responseStart - connectEnd. - DNS and redirect: DNS and redirect time measures the time spent resolving the domain name, including any HTTP redirects. Measured by the
domainLookupEndtiming property. - Connection time: Connection time measures the time spent establishing a connection, i.e. the time from when the DNS lookup has resolved until the browser has established a connection. Measured as
connectEnd - domainLookupEnd.
How performance monitoring works
The performance metrics are measured in the browser, and the values reported by the browser are sent to the CatchJS server. The data is sent when the tab showing the page is closed, is navigated away from or when the tab goes from being visible in the browser to being hidden. In technical terms, the script uses the pagehide and visibilitychange events to determine when to send the data.
All metrics are not supported by all browsers, so the CatchJS script will collect the metrics that are available. This means that the amount of data backing each statistic shown in your performance overview may be different from metric to metric. The number of samples backing each metric can be seen by going to the performance overview for a particular page.
Some metrics directly relate to rendering speed and interaction delay when the user loads the page. Whenever a page is loaded in the background (for example when the user opens a link in a background tab), these metrics would be misleading, as the browser can delay loading and rendering of these pages arbitrarily. For this reason, background loading is detected by the catch.js script, and page measurements for these metrics will not be included in the statistics shown in your performance overview. This filtering happens for the following metrics: Cumulative Layout Shift, First Input Delay, Largest Contentful Paint, First Paint and First Contentful Paint.
You'll generally analyze the performance metrics by looking at percentiles. For example, the 75th percentile is the value such that 75% of measured values are below it. Looking at percentiles gives you a robust statistic that will vary less over time than for example the average value. The percentiles shown are accurate approximations, that have less than 0.4% relative error. Because percentiles are expensive to compute, but more robust statistically, a trade-off has to be made between computational feasibility and statistical robustness. For this reason, the performance metrics are sampled at a maximum of one measurement per URL every 5 minutes. If multiple measurements arrive in a 5 minute window, the service will pick a measurement from a non-background load, if such a measurement arrives within the time window. Performance metrics are collected for the most popular URLs by their number of pageviews in the past week, as described in the section on quotas.
How is time-on-page measured
The time-on-page measurement is measured as the time between the page is first visible in the browser until it is first hidden. Subsequent visibility changes do not affect the time-on-page measurement. The catch.js script measures this by listening for the visibilitychange event in the browser. Time-on-page is measured at the same frequency as performance metrics, see the previous section on performance monitoring for more details.
When time on page is greater than 60 minutes, it is recorded as 60 minutes. This prevents rare extreme values from skewing the overall statistics too much.
How pageview counting happens
A pageview indicates that a particular page was visible in a user's browser. Unlike some other analytics solutions, CatchJS records the pageview at the end of the user's visit on the page, either when the user navigates away from the page, closes the tab, or hides the page after first having it visible in the browser. The data is sent through the browsers navigator.sendBeacon mechanism, which ensures that the transmission doesn't interfere with navigation performance. Pageviews are not sampled, and are counted for a number of unique URLs per week, as described in the section on quotas.
How error logging works
When the CatchJS script is loaded, it attaches a handler to the window object's error event (window.onerror). This event is triggered whenever an unhandled JavaScript error happens on the page, which includes syntax errors and unhandled exceptions.
When an unhandled error happens on the page, the CatchJS script will send the error information along with metadata such as the user agent string and screen resolution to the CatchJS server. The CatchJS server will then respond with an indication of whether or not it wants a screenshot to be taken.
Whether or not the CatchJS server asks for a screenshot depends on how many screenshots have already been collected for errors of this type. It will not ask for screenshots if the per error screenshot limit for this error has been reached (see quotas). Whether or not an error is considered to be already seen depends on the error identity determined by the server, which is explained more in depth in the section on error grouping.
Error grouping
A site may produce a log of hundreds of thousands to millions of logged errors. An unstructured list of all these errors does not give a good insight into which specific problems are causing the individual errors. For this reason, CatchJS automatically groups errors.
The error grouping mechanism determines error identity by combining the error type, the error message, and the location in the source code where the error was produced, if available.
Screenshots
When an error happens for which sufficient screenshots have not yet been collected, and the account is on a plan that includes screenshot functionality, the CatchJS server responds with a request for a screenshot (see the sections on quotas and the error logging protocol.
When a screenshot is requested by the server, the client side CatchJS script will load a JavaScript file containing the rendering machinery necessary to render a screen shot of the document. Once the screenshot is rendered, it will be sent to the CatchJS server along with a list of the location of clicks that have happened on the page. The click trail can be seen overlaid on the screenshot in the web app.
Because there is a delay between the error occurring and the rendering of the screenshot, the screenshot will reflect the state of the document at some point after the error. This delay means there may be a mismatch between the screenshot and what the document looked like when the error happened, depending on the application and the interactions performed by the user.
The screenshot rendering is based on the excellent html2canvas project. Since current browser APIs do not provide a built-in mechanism to take screenshots, this code takes the current document tree and renders it to an HTML canvas object. Due to the complexity of a modern web browser's rendering engine, it is infeasible to reimplement this logic with complete fidelity in JavaScript, for many reasons. However, since this JavaScript code can piggyback on the positioning and sizing of elements that the browser has already determined, it is in many cases possible to make renderings of the document that are exact matches, or close to it, to the pixels seen by the user.
There are circumstances where this mechanism fails to capture a screenshot. One scenario is if the error happens right before a user navigates away from a page. In this case, the error is submitted to the CatchJS server, but by the time the response requesting a screenshot is produced, the user has navigated away from the page, thus no screenshot can be produced. The screenshot rendering machinery may fail to produce screenshots due to unhandled combinations of document state and browser version. The CatchJS server limits the number of times it requests screenshots for a particular error instance, which will avoid repeatedly attempting to render screenshots where this has failed in the past.
Images may show up as blank rectangles in the rendered screenshots. This happens if the images reside in a different origin to that of the web page, due to the Same Origin Policy. Similarly, if a canvas object is tainted with content from a different origin, it will not show up in screenshots.
Screenshots capture the contents of the page, so you should consider what the privacy implications are of taking screenshots in your app. CatchJS does not track users or personally identifiable information in general. Whether screenshots can contain such information depends on the application. For this reason, CatchJS gives you fine grained control over when screenshots are taken. By setting the window.catchjs_config.screenshots property to false before loading the CatchJS script, you can turn off screenshots altogether. You can also alter this property at runtime, allowing for fine-grained control over when screenshots can be taken. See the section on configuration for more information.
Generic logging via catchjs.log()
In your code, you can use the catchjs.log() function to log any data you'd like. It works like the console.log() function, except the logged data will show up in your CatchJS log.
The function takes a variable number of arguments, serializes them, and sends them to the CatchJS server. These logged objects will then be immediately available and inspectable in your log, along with the associated timestamp and user-agent as well as the page they were logged from. The CatchJS script will intercept calls to console.error() and pass them through catchjs.log() as well.
The logged objects can be of any JavaScript type, and will be serialized to JSON before being sent to the server. The objects will first be decycled, meaning cyclic references will be detached before serialization and reattached server side before being displayed. Very large objects will be truncated via an adaptive truncation algorithm, that truncates the representation of properties in order to keep the object within a manageable size. In other words, you can use catchjs.log() without worrying about the various pitfalls of serialization and logged data size, it will just work.
In your code, you can make a call like this:
catchjs.log("Unexpected parameter: ", obj);
Which would result in a log entry like this:
What makes CatchJS fast?
Web site owners are rightly concerned with the speed of their site, as speed is an important determinant of a good user experience. Creating a fast web site often amounts to reducing the amount of stuff that is on a page, so adding anything new should rightly be evaluated for its performance implications.
The CatchJS script particularly shines when it comes to front-end performance. It achieves this by having an extremely small file size that is served by a fast globally distributed content distribution network. A lot of work has been put into making the CatchJS script small and light: Over the years, as features have been added to the script, its file size has shrunk.
Slow page load speeds are detrimental to the user experience. For example, a study by Amazon found that every 100ms of latency cost them 1% in sales. Google found that an extra 0.5 seconds in search page generation time dropped revenue by 20%. Page load speed really matters and adding an error logging and performance monitoring service shouldn't slow down your site.
To cut load latency the file is served over HTTP2 on a globally distributed CDN, that has servers spread across the globe. This means your users will get the file from a server that is close to them geographically, thus cutting down latency. To cut down latency further you might consider adding an async attribute on the script tag that loads the catch.js script. This will load the script asynchronously, which has the effect that errors happening while the catch.js script is being loaded will not be logged. This may be a fine trade-off for many sites.
Privacy protection
CatchJS tracks JavaScript errors and web performance, but not users. When data is logged, the service does not store the IP from which the error was logged, nor is there any other attempt at tracking user identity.
Regulators globally have taken interest in regulating the processing of personally identifiable information (PII). The European Union has introduced the General Data Protection Regulation (GDPR), the state of California has introduced the California Consumer Privacy Act (CCPA), and in general many countries have laws of similar scope and intent.
CatchJS takes a simple approach to this: The service does not track personally identifiable information.
If you sign up as a customer to the service, we'll need your email, name and address for billing purposes, but that's where it stops. We won't do any tracking of the users of your web site.
JavaScript errors in general relate to the inner workings of a program, not to any personal identity. Since you can write code to log any data via the catchjs.log() function, it is up to you to comply with relevant laws relating to the data you log using the service. Since screenshots capture the contents of the screen, you should consider the privacy implications of enabling this feature. For many apps, there is never any personal information on screen, while for others it may be appropriate to disable screenshots for some or all parts of the app. You have fine grained control of when this feature is enabled at runtime, see the sections on configuration and screenshots. Should you end up logging any sensitive data by mistake, you can contact us and we will assist in deleting the relevant data.